See recent checks in context
Availability data sits next to protection, billing, and onboarding state rather than living in a separate silo.
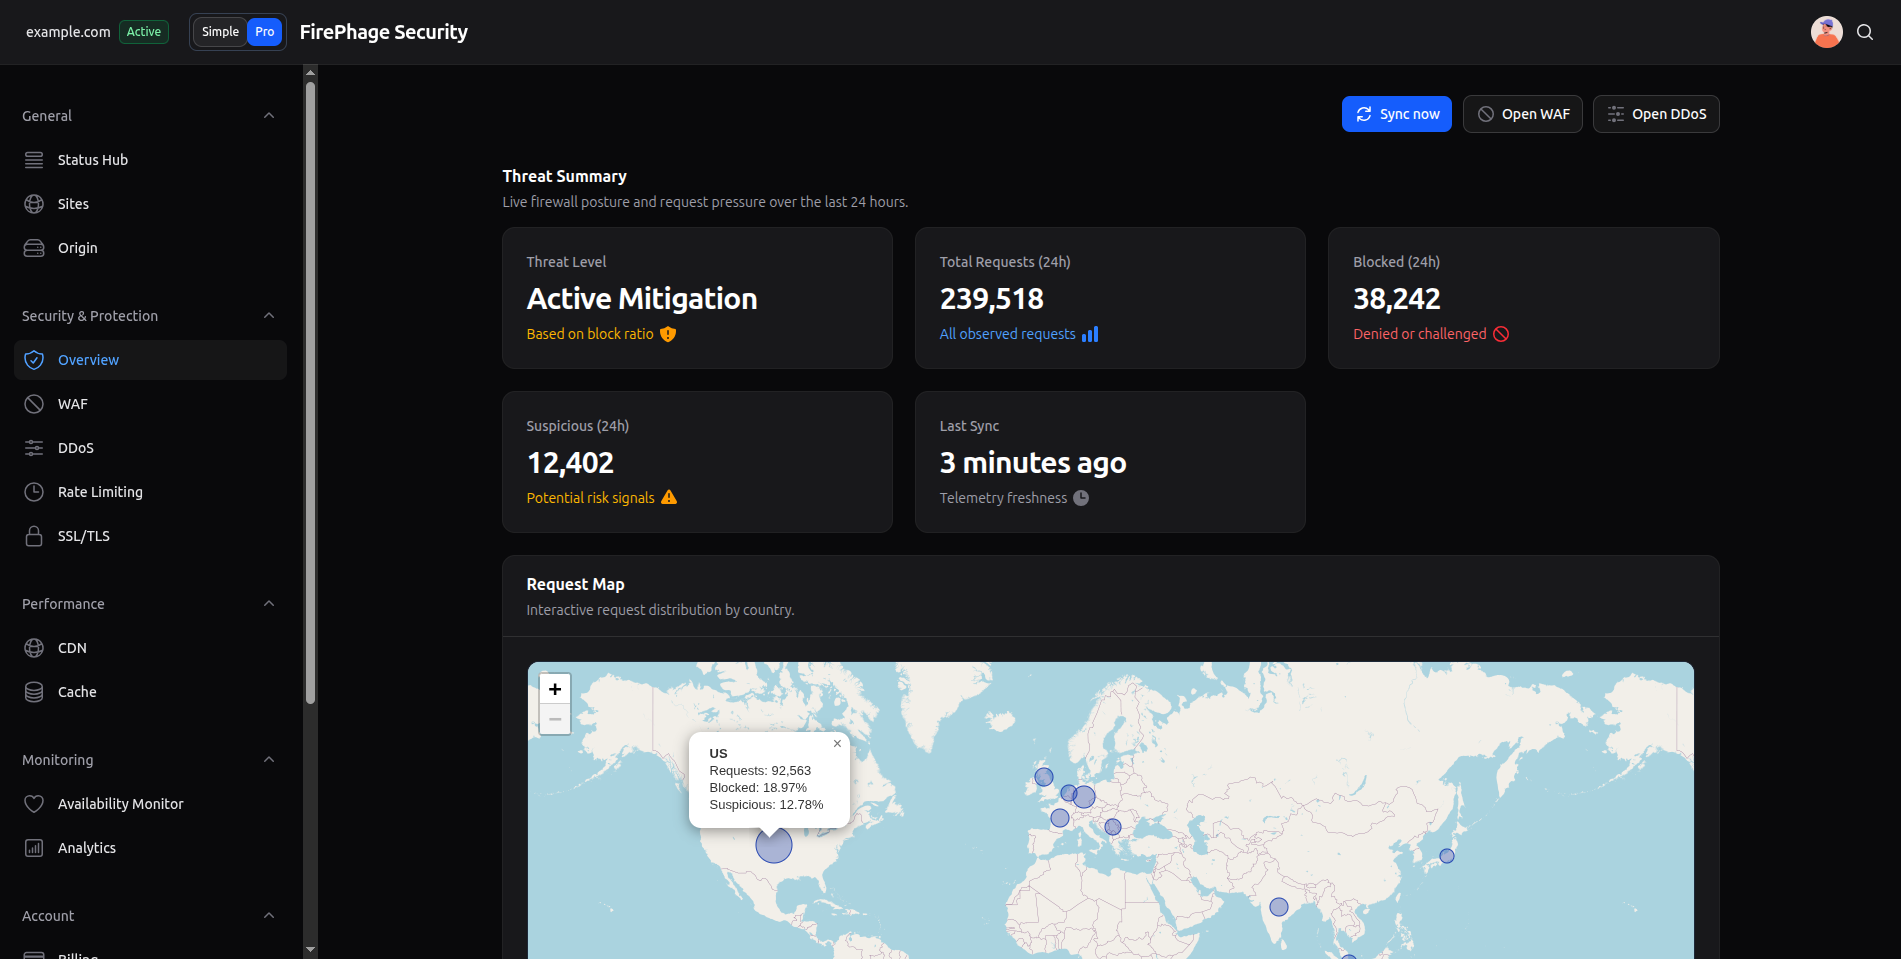
Availability Monitoring
FirePhage tracks availability so teams can see service state, recent checks, and health changes in the same environment used for protection and onboarding. It is built for operators who want fewer blind spots, not another disconnected monitor tab.
Recent checks
Visible
Operational context
Unified
Alert readiness
Actionable
Availability stability view
See recent checks in context
Availability data sits next to protection, billing, and onboarding state rather than living in a separate silo.
Spot failures earlier
Teams can review recent check results and service posture before incidents become customer-facing confusion.
Understand operational state faster
Availability becomes part of the same product story as edge delivery and protection.
Problem this solves
Teams often discover availability issues too late, or only after jumping between multiple dashboards that do not match the rest of their operational workflow.
Example: checkout complaint before sales drop
A store owner hears that the site felt unstable. FirePhage check history helps the team confirm whether there was an actual availability issue and when it started.
Recent checks table
Operators can review what was checked, when it was checked, and whether the site was up or down.
Manual checks when needed
Teams can trigger checks directly when validating site state or recent changes.
One dashboard view
Availability is not detached from the rest of the site lifecycle inside FirePhage.
Useful alert direction
The monitoring layer fits naturally with the alerting model already built into FirePhage.
How it fits FirePhage
Every FirePhage service page is meant to explain one capability clearly, then connect that capability back to pricing, onboarding, the dashboard, and the real website problems teams are trying to solve.
Related guides